
BNPPRE Dashboards
The BNP Paribas Real Estate Dashboards offer us a wide range of opportunities to present real estate markets digitally and interactively. Be it at your desk or when out and about, their responsive layout enables you to view, analyse and discuss the latest market developments in different asset classes on your smartphone, tablet, PC or laptop. What’s more, the integrated filter function allows you to clearly view and compare large amounts of data at a glance. Why open a multitude of individual files or carry around pages upon pages of documents when you can quickly access an up-to-date market or location overview with just a tap or a click?


Office market key figures
Office market Q3 2026
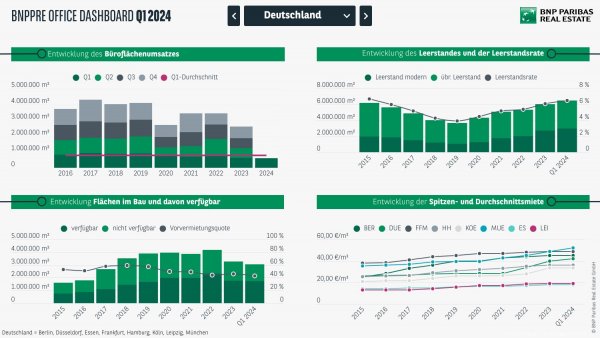
By the end of the third quarter, office take-up across Germany’s key office markets of Berlin, Düsseldorf, Essen, Frankfurt, Hamburg, Cologne, Leipzig, and Munich totaled just under 2.0 million sq m, broadly in line with the previous year’s level (-1.6% y-o-y). Rising interest rates, a weak economic environment, and increasingly refined occupier requirements had the potential to weigh significantly on leasing activity during the summer months. Against this backdrop, it is all the more noteworthy that office take-up actually recorded a moderate quarter-on-quarter increase in the majority of the markets analyzed. Berlin, Munich, and Düsseldorf stand out with double-digit growth rates, making a particularly positive contribution to the overall result. Most markets reported higher take-up volumes in the third quarter, albeit from a relatively low base.
Investment market key figures
Commercial investment market Q3 2026
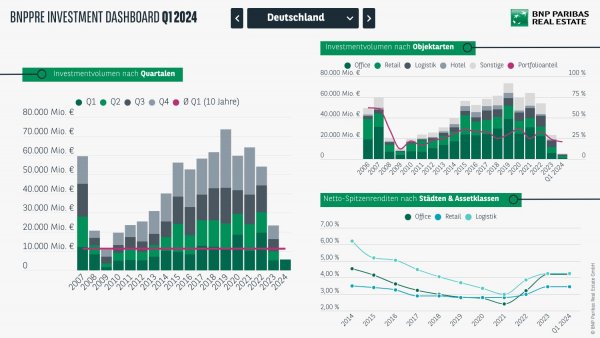
After the first three quarters, commercial investment volume stands at approximately €17.1 billion, representing a 2% decline year-on-year. Performance was driven primarily by a strong start to the year, with investment volume reaching €6.9 billion amid improving market conditions and growing investor confidence. However, the escalation of the Iran conflict in March and the subsequent shift in capital market sentiment weighed noticeably on market confidence and transaction activity. A weaker second quarter (€5.4 billion) was followed by a subdued third quarter, which recorded investment volume of just under €4.9 billion. As a result, the year-on-year lead that still existed at mid-year has now been fully eroded.
Green Building Dashboard
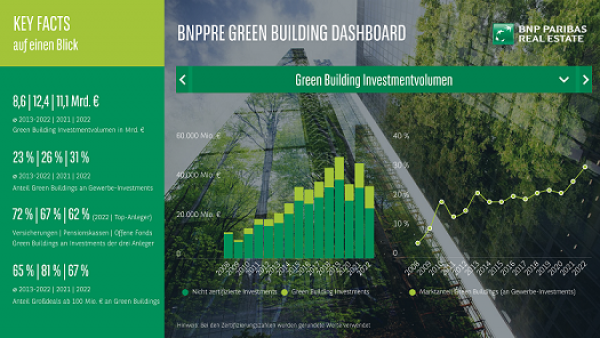
The share of certified green buildings within the commercial investment volume (excluding portfolios) remains at a very high level, even in a challenging market environment. After the top figure of just under 31% in 2022, around 27% was achieved in 2023. This is the second-highest share in the last 10 years and confirms the importance of green investments. While the EU Taxonomy mainly concerned companies in the real estate sector that wanted to place funds on the capital market, it is now affecting more and more market participants. Accordingly, sustainability regulations are becoming increasingly important for investors and buyers across the board, while at the same time occupiers (tenants and leaseholders) must now also take taxonomy criteria into account in their corporate governance. Against this backdrop, proactive management will remain the order of the day in 2024.
Logistics market key figures
Logistics market Q3 2026
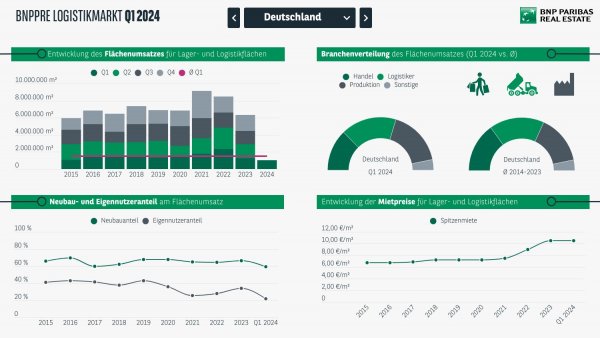
Demand in the nationwide warehouse and logistics market remains consistently high. Following the first three quarters of 2026, the take-up amounts to 5.5 million sqm, representing a 28% increase compared to the same period last year and remaining significantly above the ten-year average by 9%. Despite moderate economic growth and challenging geopolitical conditions, momentum has steadily increased throughout the year, as reflected in the rising quarterly results. The third quarter, in particular, saw a further increase of 23% over the second quarter, reaching nearly 2.2 million sqm —the highest result since the second quarter of 2022. The primary drivers of current momentum are, on the one hand, logistics service providers managing operations for Asian e-commerce companies as well as long-established large corporations, and on the other, companies within the armaments and defence sector. Overall, there has been a noticeable increase in both the number of large-scale contracts and the total number of deals concluded compared to the previous year. Locations outside the major logistics hubs have seen the most significant growth, increasing by 51% year-on-year, whereas the top logistics markets (Berlin, Düsseldorf, Frankfurt, Hamburg, Cologne, Leipzig, and Munich) recorded a decrease of 5%, with a total volume of just under 1.7 million sqm.
Retail market key figures
Retail market Q2 2026
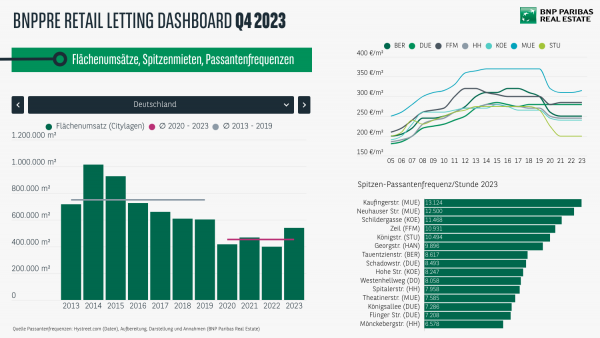
In the first half of 2026, the retail market once again confirmed its currently very positive demand momentum, recording another high take-up result of around 238,000 m². Although this fell slightly short of the remarkable figure achieved in the same period last year (H1 2025: 251,000 m²; -5%), the retail sector nevertheless posted an above-average half-year result in terms of letting volume in city-centre locations (average since 2020: just over 228,000 m²). Department store re-lettings were a key driver of the strong prior-year result, generating a volume of almost 44,000 m² in the first two quarters of 2025 alone, equivalent to 17% of the total. However, around 26,000 m² has already been let in former Galeria and fashion department stores in the year to date, representing an 11% share and underlining the continued strong momentum in this segment. International retailers are also currently providing important stimulus for the German retail market: almost 15 market entries have been recorded since the beginning of the year, already exceeding the total for 2025 as a whole. These included the US activewear brand Alo Yoga on Münzstraße in Berlin and outdoor equipment specialist Yeti on Georg-Kronawitter-Platz in Munich. Overall, brands from the US accounted for 12% of deals, making them the second most active region of origin among international labels, behind Danish brands at 17% and slightly ahead of Asian players at 10%.
Residential market key figures
Residential Dashboard Q2 2026
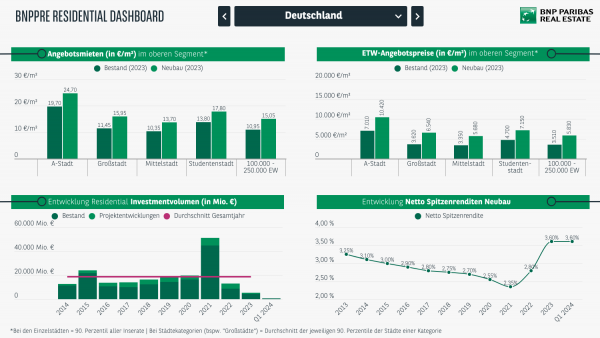
The German residential investment market recorded an overall solid first half of 2026. In the first six months, around €4.4 billion was invested in residential portfolios comprising 30 units or more. This puts the result only slightly below the previous year’s level (-3%). At the same time, however, the market structure has become significantly broader: while the previous year was shaped by a small number of large-volume portfolio transactions, the number of deals has increased in the current year. Despite economic weakness and geopolitical uncertainties, the market environment remains fundamentally supportive. On the demand side, persistently strong demand for housing is coinciding with limited new-build activity, further exacerbating supply shortages, particularly in prime locations. The resulting rental growth strengthens the appeal of the asset class and underlines the role of residential property as a resilient investment haven in a volatile environment.
Residential rental & purchase price navigator
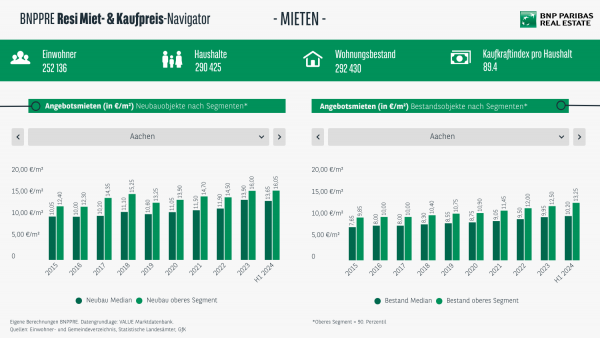
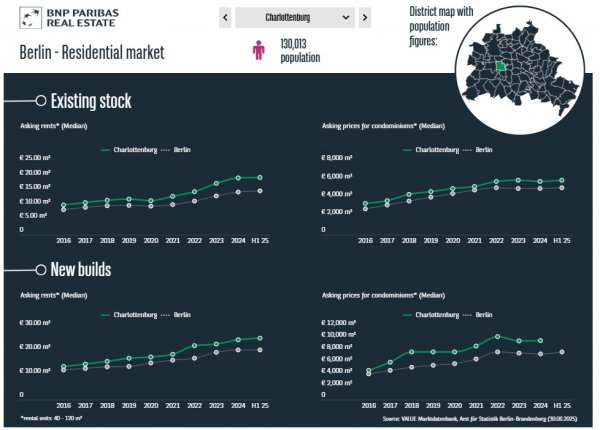
The residential markets of the most popular metropolises in Germany have been dominated by rising rental and purchase prices for years. But what is the situation in the rest of the country? BNPPRE investigated this question and analyzed all 108 independent cities in Germany. With the BNPPRE Residential Navigator, which is updated every six months, you can make further progress through the numerous residential markets and keep an eye on rental and purchase price developments (for condominiums) in the new builds and existing stock as well as other key figures.
Hotel Dashboard Q3 2026
The hotel investment market presented a mixed picture after the first three quarters. On the one hand, the absence of major volume drivers resulted in a transaction volume of around €1 billion, down just over 27% on the strong prior-year period. On the other hand, deal activity painted a very different and significantly more positive picture of market sentiment. By the end of September 2026, around 27% more transactions had been recorded than in 2025, marking the highest deal count for the first three quarters since 2022. Accordingly, market momentum in the hotel sector has by no means weakened but is currently characterized by many smaller transactions.
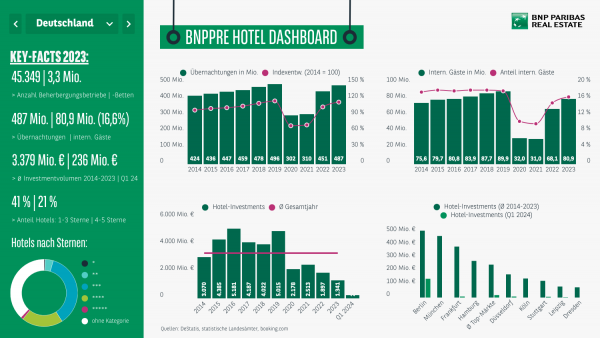
Hotel market key figures
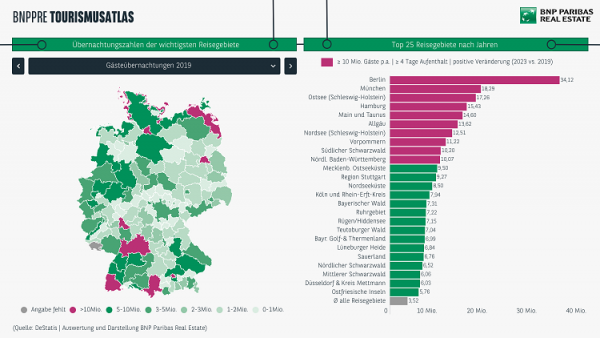
BNPPRE Tourism analyser
On the German hotel market, all key performance data indicates a sustainable recovery in tourism in Germany after the challenging COVID-19 years of 2020 and 2021. Significant increases in overnight stays by guests in accommodation establishments were already evident in 2022 (+49%) and 2023 (+61%). In 2024 around 496 million overnight stays were recorded, which not only exceeds the pre-COVID-19 figure from 2019, but also represents a new record in a long-term comparison. This reflects the resurgence in demand from city and business tourism as well as guests from abroad. Compared to the previous year, the number of overnight stays by foreign guests rose by a good 5% (85 million guests in 2024). Other key figures such as room occupancy and average prices also developed positively. By 2024, the occupancy rate had returned to a high level of just under 67% nationwide. The top 5 most popular travel destinations in 2024 are Berlin (31 million guests), Munich (20 million guests), the Baltic Sea (19 million guests), Hamburg (16 million guests) and the Main/Taunus region with 15 million guests. Furthermore, 52 million overnight stays were already registered between January and February 2025 - a strong signal for a continued positive trend in the current year.
While some dashboards are no longer up to date, they still offer an exciting insight into the various markets. Scroll through our dashboard archive here:

KEY FIGURES AND ANALYSES
ON THE GERMAN REAL ESTATE MARKET
Find out more about the latest developments in the investment, office, logistics, retail, hotel, healthcare and residential real estate markets to base your property decisions on a strong foundation of solid market information. We are happy to provide you with an extensive overview of property-related developments throughout Germany and details of the real estate markets of the largest German cities.